How do penalty points and driving offences affect car insurance?


Key takeaways
Committing driving offences can lead to you getting penalty points on your driving licence
The more points you have on your licence, the more you’re likely to pay for car insurance
Some insurers might even refuse to cover you if you have too many points on your licence

What are penalty points?
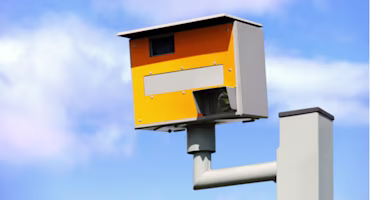
Penalty points, also known as driving endorsements, are what you get if you’re convicted of a driving offence like speeding or dangerous driving. The number of points you’ll be assigned will depend on the driving offence you’ve committed.
How do penalty points affect my car insurance?
Having penalty points on your licence will likely lead to your car insurance premiums going up, and if you get too many points some insurance providers may even refuse cover outright.
Penalty points indicate that you were driving or using your car irresponsibly, meaning you’re at a higher risk of claiming on your car insurance policy.
Do all penalty points affect my car insurance?
Yes, all penalty points will affect your car insurance premiums. But insurers will also see your driving convictions that got you the points, so the nature of your driving offence will affect how much your premiums go up.
Do I have to tell my insurer about penalty points on my licence?
Yes, you should tell your insurer about any penalty points you’ve had that haven’t expired otherwise your insurer might void your cover.
Paying higher premiums is better than finding out you can’t claim on your policy at all because it’s invalid. Driving without insurance is also illegal and has serious consequences if you’re caught.
Do I have to declare all driving convictions?
Yes, you need to declare all unspent driving convictions on your record - failure to do so will result in your policy being invalidated.
However, after a certain amount of time your conviction will become ‘spent’, so you won’t need to tell your insurer, even if they ask.
How long do penalty points stay on my licence?
Penalty points will stay on your driving record for either 4 or 11 years, depending on the nature of the offence you committed. The time will start either from the date of the conviction or the date of the offence.
How are penalty points issued?
Penalty points are issued either:
When you accept a Fixed Penalty Notice (FPN). For example, for a minor speeding offence
When you are convicted in court for a motoring offence
The points are added to your driving licence digitally by the DVLA, after the police or courts have notified them of the driving offence.
The more serious your offence is the more points you will get on your driving record.
Did you know?
Just under half (43%) of cars exceeded the limit on 30mph roads in 2024 and a similar number (44%) exceeded the limit on motorways, according to the Department for Transport.
What happens if I get too many points on my licence?
If you accumulate 12 or more penalty points on your licence within a three-year period, you’ll be disqualified from driving. The length of your driving ban will depend on your history of convictions:
If you’ve had 12 or more penalty points within three years your ban can last up to six months
If you get a second disqualification within three years your ban could last up to a year
If you get a third disqualification within three years, it could last up to two years
If your disqualification lasts for 56 days or longer you’ll need to reapply for your driving licence, and possibly even have to retake your driving test
The rules are different for new drivers:
If you get six or more points within two years of passing your test your licence will be cancelled (revoked)
Penalty points on your provision licence are transferred to your full licence (if they haven’t expired)
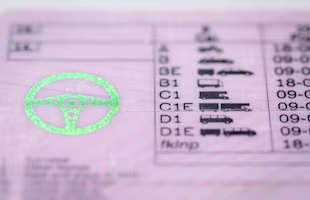
How can I check how many penalty points I have?
You can see how many penalty points you have on your record by viewing your driving licence on gov.uk. Just have your driving licence number and your national insurance number at hand.
What are the different types of driving offences?
The different types of driving offences have their own assigned codes and range of penalty points usually given for each offence. For example, speeding offences are references as SP followed by a number – and is usually worth 3-6 points.
The different types of driving offences, their codes and the points you’ll usually get are as follows:
Offence code | Offence category | Penalty points |
|---|---|---|
AC | Accident offences | 4 to 10 |
BA | Disqualified driver offences | 3 to 11 |
CD | Careless driving | 3 to 11 |
CU | Construction and use | 3 to 6 |
DD | Reckless and dangerous driving | 3 to 11 |
DR | Drink driving | 3 to 11 |
DG | Drug driving | 3 to 11 |
IN | Insurance offences | 6 to 8 |
LC | Licence offences | 3 to 6 |
MS | Miscellaneous offences | 3 to 11 |
MW | Motorway offences | 3 |
PC | Pedestrian crossings | 3 |
SP | Speeding | 3 to 6 |
TS | Traffic directions and signs | 3 |
How can I get cheaper car insurance with penalty points on my licence?
Having points on your licence might mean your car insurance premiums are likely to be higher, but you can still take certain steps to bring down the cost of cover:
Insure a smaller car: Smaller and less powerful cars in lower car insurance groups are seen as a lower claim risk by insurers, so you might be able to reduce your premiums a little
Take out telematics cover: Telematicsdevices (also known as black box devices) monitor your driving and report back to your insurance company, meaning that good, safe driving habits will result in a lower price to insure your vehicle
Pay more excess: Paying a higher voluntary excess indicates to insurers you’re less likely to make frivolous claims, so they’ll reward you with lower premiums
Pay annually: Your total cost will work out cheaper if you pay up front for the full year instead of paying monthlyfor car insurance
Add an experienced driver: Adding an experienced motorist to your policy as a named driver can help reduce your premiums if you’re a young driver with penalty points. Just be sure you’re honest about who’s doing more of the driving, otherwise you could be guilty of something called fronting
How can I find a good deal on my car insurance with penalty points?
Even if you have penalty points on your licence, it’s always good to compare car insurance quotes online to be sure you’re getting the best deal possible.
Just tell us a little about yourself, your car and the cover you need, and we’ll search the market for deals that match your requirements.
You’ll be able to compare offers by the overall cost, the cover you’ll get and the excess you’ll need to pay to make a claim. Once you’ve found the one you want, just click through to the insurance provider to finalise your purchase.
Author
Mehdi Punjwani
Insurance specialist
Mehdi is a financial writer and editor with over six years of experience in personal finance. He has written for organisations and publications including Equifax, The AA, and USAToday, covering a...
Reviewer
Sarah Tooze
Car & Van Insurance Expert
Sarah Tooze has been a motoring journalist for more than 15 years, specialising in company cars and vans, and has won a number of awards during her career, including the Newspress ‘Automotive...